




Blitz India Business
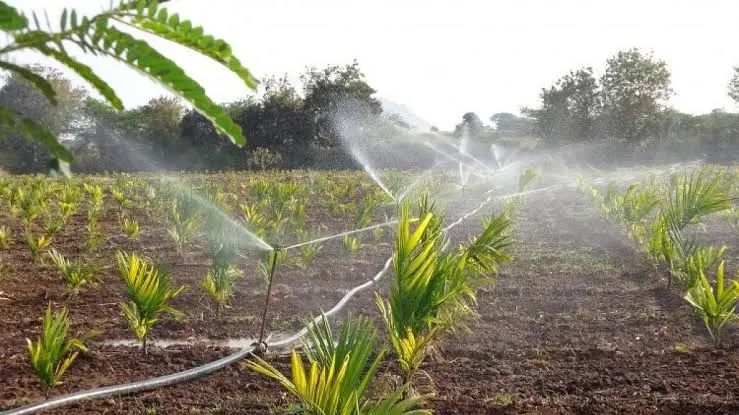
NEW DELHI: Micro irrigation took thirty-six paise of every rupee the country’s flagship farm scheme spent last year. It reaches 8.11 per cent of the sown area. Both facts are in the same document, and together they are an investment case.
The Press Information Bureau’s research unit published More Crop Per Drop with Water-Smart Farming on 29 August 2026, explainer number 159757, citing the Ministry of Agriculture and Farmers Welfare, the NITI Aayog evaluation of 2020-21, the Economic Survey 2020-21 and a 2023 study by IIM Ahmedabad. Read as a market document, it describes a category with a very long runway and a published unit economics.
The size of the addressable market
More than 80 per cent of India’s available water goes to agricultural irrigation, and only about 50 per cent of the net sown area is irrigated at all. Per Drop More Crop had covered 115 lakh hectares by July 2026, which the document puts at 8.11 per cent of net sown area. Blitz India inverted that ratio: it implies a net sown area of about 141.8 million hectares, and it leaves 91.89 per cent of the sown area outside micro irrigation. For a manufacturer of drip and sprinkler systems, that is the addressable market, stated by the government, in one line.
The unit economics, as published
The subsidy is capped at five hectares a beneficiary, at 55 per cent of cost for small and marginal farmers and 45 per cent for others, with repeat assistance on the same land permitted after seven years — which is, in effect, the government’s own view of the replacement cycle, and therefore the industry’s repeat-order cycle.
The Centre released ₹8,123.24 crore over the last three years, an average of ₹2,707.75 crore a year, recomputed. In 2025-26, ₹3,226.36 crore went to Per Drop More Crop out of ₹8,957.72 crore released or approved for the Pradhan Mantri Rashtriya Krishi Vikas Yojana — 36.02 per cent of the parent scheme. The scheme reached 12.30 lakh farmers, about 20 per cent of them women; average central support works out to about ₹26,231 a farmer. States are free to add subsidy from their own budgets, so the figure understates the total public support behind each installation.
Coverage, subsidy and the published returns
| Parameter / Metric | Details |
|---|---|
| Area covered, July 2026 | 115 lakh hectares |
| Coverage of net sown area | 8.11 per cent |
| Sown area still uncovered | 91.89 per cent |
| Implied net sown area | About 141.8 million hectares |
| Subsidy cap | Five hectares a beneficiary |
| Subsidy rate | 55 per cent small and marginal; 45 per cent others |
| Replacement cycle recognised | Seven years |
| Central release, three years | ₹8,123.24 crore — ₹2,707.75 crore a year |
| PM-RKVY, 2025-26 | ₹8,957.72 crore |
| Of which micro irrigation | ₹3,226.36 crore — 36.02 per cent |
| Farmers reached, 2025-26 | 12.30 lakh |
| Average central support a farmer | About ₹26,231 |
| Water saving, Economic Survey 2020-21 | 20 to 48 per cent |
| Energy saving | 10 to 17 per cent |
| Labour cost reduction | 30 to 40 per cent |
| Fertiliser saving | 11 to 19 per cent |
| Yield increase | 20 to 38 per cent |
What the evaluations say about returns
The ranges are wide and are given here intact. The NITI Aayog evaluation of 2020-21 recorded income gains of 10 to 69 per cent and water use efficiency improvements of 30 to 70 per cent. The Economic Survey 2020-21 quantified water saving of 20 to 48 per cent, energy saving of 10 to 17 per cent, labour cost reduction of 30 to 40 per cent, fertiliser saving of 11 to 19 per cent and yield increase of 20 to 38 per cent. The IIM Ahmedabad study of 2023, across six states, found the dominant adoption motive to be falling groundwater levels.
The energy and fertiliser savings are the two that a policy investor should follow, because they land on the public balance sheet rather than the farmer’s. Every unit of pumping avoided is a subsidised unit of power not drawn, and every kilogram of fertiliser saved is a subsidy not paid. Neither the explainer nor this desk quantifies that fiscal return, and it is not asserted here — but it is the calculation the exchequer has the data to do.
The rule change that opens a second market
Under revised guidelines the funding ceiling on water storage and conservation activity has been removed. Previously a general state or union territory could spend at most 20 per cent of its allocation on such work, and the north-eastern and Himalayan states and the union territories of Jammu and Kashmir and Ladakh at most 40 per cent. States may now exceed those limits according to local need. The “other interventions” component supports diggis — large storage tanks and farm ponds — and water harvesting structures, built for individual or community use.
Commercially this converts a single-product scheme into two. Drip equipment without assured water is idle capital; storage is what makes the system bankable. Lining, pumping, filtration and solar pumping all sit inside that newly uncapped line.
The suggestion is about the one number the market cannot get. National coverage is published; state-wise coverage against each state’s own sown area is not. A single annual table from the Ministry of Agriculture and Farmers Welfare — state, net sown area, area under micro irrigation, coverage percentage, area added in the year — would let a manufacturer size its dealer network and a lender price its farm-equipment book against something better than a national average. The scheme’s monitoring system already holds every one of those fields.