




Blitz India Business
NEW DELHI: India’s July export number was the best in months. The number printed beside it grew more than twice as quickly — and that is the one a treasurer should be modelling.
Total exports of goods and services reached $80.14 billion in July 2026, up 13.3 per cent year-on-year, on provisional Commerce Ministry data. The performance was led by merchandise, which rose 19.6 per cent to $44.24 billion — the faster of the two legs, and a reversal of the pattern of recent years in which services carried the aggregate. Growth in goods shipments came from petroleum products, electronic goods, engineering goods, organic and inorganic chemicals, and cotton yarn and handloom products. Cumulatively, merchandise exports over April to July of the current financial year stand at $173.78 billion, 17 per cent higher than a year earlier.
Now the second number. The merchandise trade deficit widened 31.5 per cent year-on-year to $15 billion in July. Set the two growth rates side by side — goods exports up 19.6 per cent, the goods deficit up 31.5 per cent — and the arithmetic resolves: merchandise imports grew faster still. A deficit that widens while exports accelerate is not a demand failure. It is the signature of an economy importing inputs and energy at a rate that outruns what it ships out, which is what a capital-expenditure cycle and a firm oil price look like when they arrive in the same month.
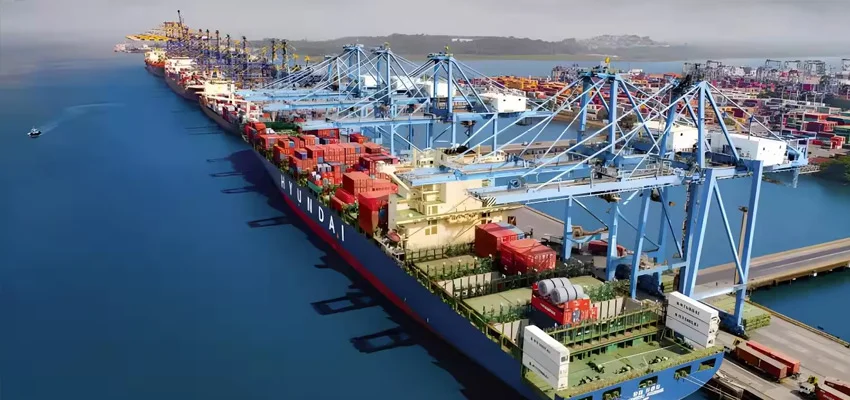
The faster leg, for once: merchandise exports rose 19.6 per cent in July to $44.24 billion, outpacing the services line — while the goods deficit widened faster still, by 31.5 per cent.
Exports up 19.6 per cent and the deficit up 31.5 tells you only one thing with certainty: imports grew faster than both.
At a Glance
• Total exports, July 2026: $80.14 billion
• Year-on-year growth: 13.3 per cent
• Merchandise exports: $44.24 billion, up 19.6 per cent
• Merchandise trade deficit: $15 billion, up 31.5 per cent
• April–July merchandise exports: $173.78 billion
• Cumulative growth: 17 per cent year-on-year
• Growth drivers: petroleum products, electronic goods, engineering goods, chemicals, cotton yarn and handloom
• Data status: provisional, Commerce Ministry
• Cushion against the deficit: reserves at $707 billion on 7 August
The composition of the export basket is the part worth dwelling on, because it says something about where India’s industrial gains are landing. Petroleum products and chemicals are refining and process industries — capital-intensive, import-dependent for feedstock, and therefore contributors to both sides of the trade account at once. Electronic goods and engineering goods are the assembly-and-fabrication end, where a decade of production-linked policy has been concentrated. Cotton yarn and handloom is the labour-intensive tail, and the one most exposed to tariff arithmetic in destination markets. Three different economics under a single headline growth rate.
For a treasurer or an exporter, the practical reading is that the July print supports volumes but does not settle the currency question, which is why the $707 billion reserve position matters more this month than it did last. The constructive path is visible in the same data: the fastest-growing lines are the ones where India has been building capacity for a decade, which suggests policy is converting rather than merely announcing. Sustaining it means holding input costs down while the capex cycle runs — the reason today’s offshore exploration outlay and the nuclear capacity target are trade stories as much as they are energy stories.